http://www.factcheck.org/2015/04/obamas-numbers-april-2015-update/
Summary
Highlights from our latest update of the statistical record of President Obama’s time in office:- Under Obama, the economy has added 7.2 million jobs, and the unemployment rate is now lower than the historical median.
- The number of job openings is up to its highest point in 14 years, and the number of long-term jobless has now dropped below where it was when Obama took office.
- Real weekly earnings are up 3 percent. But the number of persons receiving food stamps remains stubbornly high.
- The administration says 16 million have gained health insurance as a result of the Affordable Care Act. But the National Center for Health Statistics estimates that 37 million others still lacked coverage last year.
- The US increased its domestic crude oil production last year by more than it has in over 100 years. The U.S. now relies less on imported oil than it has since the Nixon administration.
- The clock has run out on Obama’s promise to double U.S. exports in 5 years. They went up only 39 percent.

Analysis
As we do every three months, we offer here a fresh update of selected statistical indicators of what has happened since Barack Obama first took the oath of office in January 2009. Some are positive and some are not, but all are from sources we consider solid and reliable. And as usual, we caution that no single number or collection of numbers can tell the entire story.
Jobs & Unemployment
Number of Jobs — The jobs figure for March stands 835,000 higher than we reported three months ago. The economy has now added 7,206,000 jobs since Obama first took office.
Unemployment Rate — Meanwhile the unemployment rate
ticked down another tenth of a point, to 5.5 percent. That’s a decline
of 2.3 percentage points since the recession-plagued month of January
2009, when the president first took the oath of office.
Historically, the jobless rate is now a bit
better than it has been most of the time since 1948. The historical
median is 5.6 percent.
Long-term Unemployment — February also saw the number of long-term unemployed
— those who have been looking for work for 27 weeks or longer — drop
below the level Obama inherited. The number went down to less than 2.6
million in March, which is 136,000 fewer than when the president first
took office and less than half the 6.8 million figure chalked up in
April 2010.
Job Openings — The number of job openings
rose in January (the latest month on record) to just under 5 million,
the highest level since January, 2001. The number of openings has gone
up 81 percent since the month when the president entered office.
Business Startups — New businesses are opening at a rapid pace. The Bureau of Labor Statistics counted 220,000 “births” of new establishments
in the three months ending last June, the most recent period on record.
That’s an increase of just under 18 percent compared to the quarter
just prior to Obama’s first inauguration.
On the other hand, the number of business
establishments shutting down permanently — business “deaths” — has gone
down by just over 18 percent. The most recent figure is for the third
quarter of 2013, because the BLS must wait a year before counting any
shutdown as a permanent closing. Establishment birth and death figures
are adjusted to compensate for seasonal variations.
Prices & Wages
Consumer Prices – Overall inflation in consumer
prices has remained moderate over Obama’s first six years, rising by
only 11 percent between January 2009 and February, the most recent month
for which the Bureau of Labor Statistics has released the Consumer Price Index.
The average yearly rise under Obama of 1.9 percent is well below the
post-World War II average of 3.7 percent. And thanks mainly to falling
fuel prices, the CPI has actually dropped 0.8 percent since our last
report.Real Weekly Earnings – As a result, the purchasing power of weekly paychecks took another big jump since our last report. The BLS measure of average weekly earnings for all workers, adjusted for inflation and seasonal factors, was 3 percent higher in February than it was when Obama first took office.
Most of that gain is recent. Real weekly earnings have gone up 2.5 percent since fuel prices started dropping last June.
Gasoline – The national average price of regular gasoline has rebounded somewhat since the plunge that took it down to just over $2 a gallon in January. As of the week ended March 30, it stood at $2.45, according to the U.S. Energy Information Administration.
That’s 33 percent higher than the unusually low point at which it stood on Inauguration Day 2009, but also 32 percent lower than it had been at the end of March 2014.
Food Stamps
The number of persons receiving food stamps edged down only slightly
since our last report despite the rapidly improving economy. As of
December, the most recent month on record, nearly 46.3 million Americans
were receiving the food aid, now known as Supplemental Nutrition
Assistance.That’s only 3 percent below the record level set three years earlier, in December 2012, and nearly 45 percent higher than it was when Obama took office in 2009.
Nevertheless, Obama does not quite qualify for the label that former House Speaker Newt Gingrich came up with during his 2012 run for the Republican presidential nomination. Gingrich called Obama the “food stamp president” and claimed he had added more recipients to the rolls than any previous chief executive. But that was not true at the time , and only later did the gain under Obama exceed the number added under his predecessor. Now, however, the title has gone back to George W. Bush; 14.7 million were added to the rolls during his time in office, and 14.3 million were added during Obama’s.
Home Ownership
The rate of home ownership has slipped again since our last report, to its lowest point in more than 20 years.As of the final quarter of 2014, the percentage of U.S. households who owned their own homes was 64.0 percent, according to the most recent release from the U.S. Census Bureau. That is lower than at any time since the third quarter of 1994.
Home ownership peaked at 69.2 percent in 2004, but it has declined 5.2 percentage points since then. Most of the decline — 3.5 percentage points — has taken place since Obama first took office.
Profits & Markets
Corporate Profits — 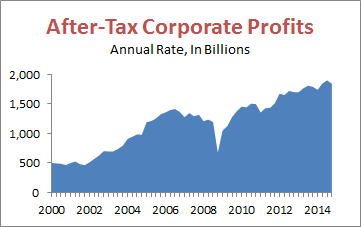 Corporate profits have soared under Obama, smashing all previous records.
After-tax corporate profits have slipped a bit since the record level reflected in our last report. However, they were still running at a yearly rate of over $1.8 trillion in the final three months of 2014, according to the most recent figures from the U.S. Bureau of Economic Analysis.
That was an increase of 174 percent over the recession-plagued quarter six years earlier, just before Obama entered office. And it was also 30 percent higher than the best quarter prior to his taking office, which was the third quarter of 2006.
The highest profits ever recorded were in the third quarter of 2014, when they were running at a yearly rate of just under $1.9 trillion.
Stock Markets – Stockholders continue to do quite well under Obama. The Standard & Poor’s 500-stock index
was 157 percent higher at the close last week than it was the day Obama
took office. Other stock indexes show similarly robust gains. The Dow Jones Industrial Average also has more than doubled, rising 123 percent during Obama’s tenure, and the NASDAQ Composite index has tripled, rising 239 percent.
Obamacare
Information about the effects of the
Affordable Care Act continues to accumulate. The verdict so far:
Millions have gained health insurance, but the percentage of the
uninsured has declined by only about a third.
The administration, based on extensive polling by the Gallup organization, states that 16 million persons have gained coverage
as a result of the law, the main provisions of which took effect last
year. The claimed total includes an estimated 14.1 million adults who
gained coverage since the start of the first open enrollment period in
October, 2013, plus an estimated 2.3 million young adults age 19 through
25 who previously gained coverage after the law began requiring that
insurance plans allow children to remain on their parents’ plans until
age 26.
Those figures are roughly consistent with recent findings by the National Center for Health Statistics,
which estimates that only 11.9 percent of all Americans lacked health
insurance at the time they were interviewed last year, down from 14.4
percent in 2013. However, that still left an estimated 37.2 million
without insurance coverage, more than twice the number the
administration figures have gained insurance.
The NCHS findings are preliminary, based on interviews conducted during the first nine months of 2014.
Federal Debt
The federal debt has continued to swell since our last report. The debt owed to the public now exceeds $13 trillion,
an increase of 108 percent since Obama first took office. The debt has
also gained dramatically even when measured as a percentage of the
nation’s economic output, or gross domestic product (GDP).
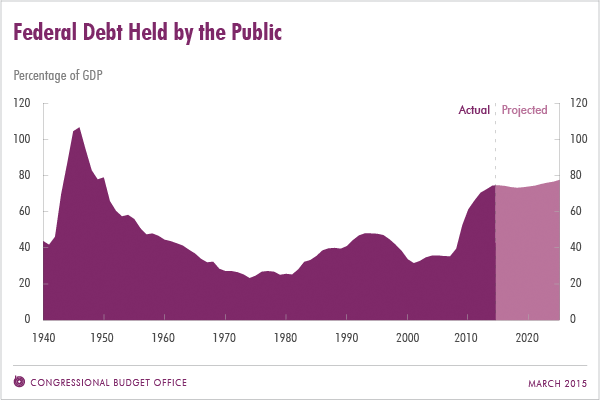 The nonpartisan Congressional Budget Office estimates
that the debt at the end of this fiscal year will amount to 74.2
percent of GDP, up from 52.3 percent at the end of fiscal 2009, which
was the last budget year in which spending and revenue levels were mostly determined by Obama’s predecessor.
The nonpartisan Congressional Budget Office estimates
that the debt at the end of this fiscal year will amount to 74.2
percent of GDP, up from 52.3 percent at the end of fiscal 2009, which
was the last budget year in which spending and revenue levels were mostly determined by Obama’s predecessor.
CBO projects that the FY 2015 deficit will
come in at $486 billion, about the same as last year’s $485 billion
deficit and about one-third of the $1.4 trillion deficit racked up in FY
2009.
But while CBO projects that deficits would
decline slightly for the next few years under current taxing and
spending policies, the annual shortfalls will resume their upward path
fairly soon. In 2019, unless something is done, the debt will begin
growing again as a percentage of the economy. By 2025 CBO estimates that
the debt would amount to 77 percent of GDP, and interest payments would
consume 13 percent of all federal spending (up from 6 percent this
year).
Total debt, counting money the government owes to itself, currently stands at nearly $18.2 trillion, up 71 percent under Obama.
Energy
U.S. Crude Oil Production – The historic boom in U.S. crude oil production has continued to accelerate under Obama. In fact, 2014 saw the largest increase in domestic petroleum production in more than a century.In the fourth quarter of last year, the U.S. produced nearly 83 percent more crude oil than it did in the three months before Obama began his presidency.
Oil Imports & Dependency — With domestic production surging, U.S. reliance on imported oil has been cut by more than half. Under Obama, as of the October-December quarter of 2014, net imports were down 59 percent.
And as a result, the U.S. imported only 26.5 percent of the petroleum and refined products that it consumed in 2014, the lowest level of dependency on imports since 1971. That was in the Nixon administration, before the first Arab oil embargo of 1973/4.
To be sure, the U.S. oil boom is due mainly to advances in drilling technology rather than to any change in government policy. The decline in dependency on imports actually began in 2006, after peaking at 60.3 percent the year before. But the trend has continued and accelerated under Obama.
Wind & Solar – Electricity generated by wind and solar power in the most recent 12 months on record (ending in January) was 252 percent higher than the total for 2008.
The increase in solar power in particular has been spectacular. The US generated nearly 22 times more electricity from solar power in the most recent 12 months than it did in the year before Obama took office.
These trends are partly due to large federal tax subsidies for wind and solar generation, all supported by Obama. But several states, independent of federal policy, have also imposed renewable energy standards that require electric utilities to generate a certain portion of their power from wind or solar. Market forces have also been at work; the price of an installed photovoltaic panel has dropped by 63 percent since the end of 2010, according to the Solar Energy Industries Association.
The U.S. produced 4.9 percent of all its electricity from wind and solar last year, up from 1.4 percent in 2008. But coal still accounted for the biggest share — 39 percent — followed by natural gas at 28 percent and nuclear power at 19 percent.
Unfulfilled Promises
Exports – In January 2010, the president said in his State of the Union address, “We will double our exports over the next five years.” But Obama didn’t even get halfway to that goal before the clock ran out.As of the final quarter of 2014, according to the most recent report of the Bureau of Economic Analysis, U.S. exports of goods and services have gone up by only 38.6 percent since Obama took office — and by only 34.7 percent since he uttered the promise.
Obama (and most economists) did not foresee the economic sluggishness of the world economy over the past five years. That has held down the ability of U.S. trading partners to buy its goods and services.
Japan was in a recession last year, for example, and Italy is still in the longest recession in its history. While the U.S. economy grew by 2.4 percent last year, the total growth of all 34 member countries in the Organization for Economic Co-operation and Development was 1.8 percent, according to OECD data.
Car Mileage — In his 2013 State of the Union Address Obama said “We have doubled the distance our cars will go on a gallon of gas,” which was not true. What he meant was that the administration was doubling the efficiency that it would call for in the future, putting in place requirements that cars and light trucks average 54.5 mpg by model year 2025.
We said at the time, “it remains to be seen whether automakers can produce — and consumers will buy — vehicles that achieve such a doubling of average mileage a dozen years from now.” And now low gasoline prices have led car buyers to temper their enthusiasm for smaller, more efficient cars and trucks, stalling progress towards Obama’s goal.
As of March, according to the University of Michigan’s Transportation Research Institute, the average EPA city/highway sticker mileage of light duty vehicles sold was 25.4 miles per gallon, exactly the same as those sold in the previous March. In fact, the average for the first six months of this model year (October 2014 through March 2015) is also exactly equal to the mileage recorded during the preceding 12 months — 25.3 mpg.
The March average is 21 percent higher than it was when Obama first took office — still a long way short of “doubled.”
Guantanamo – Since our last report, 5 more prisoners have been released from the U.S. detention facility for suspected terrorists at Guantanamo Naval Base in Cuba. But 122 prisoners remained, a figure that is still not quite 50 percent lower than it was at Obama’s first inauguration. Obama ordered the facility closed two days after he first took office, but he is not quite halfway to fulfilling that promise.
Military War Deaths
Despite the fighting raging in the Middle East, no U.S. military men or women have been killed there since our last report. The total who have died in the Iraq conflict
since Obama took office still stands at 267, and the number of U.S.
military fatalities in the Afghanistan conflict remains at 1,726. The
U.S. formally ended its combat mission in Afghanistan at the end of 2014, but thousands of U.S. troops remain there.– by Brooks Jackson
The economic recovery is continuing under Obama, much faster than predicted after the Bush recession.
ReplyDelete2.0 GDP for 7 freaking years. Market down 1.3 k in two months. largest non-participation rate since 1978, hourly wages down, parttime work is up, poverty levels are up, food stamp population is 20 million folks strnger than when Obama took office and you say the economy is booming ? You must have gotten your PhD mail order.
DeleteYou need to lose some weight or you're die soon.
DeleteDefinitely, but what has that got to do with anything. I quoted FactCheck, not FatCheck.
Delete